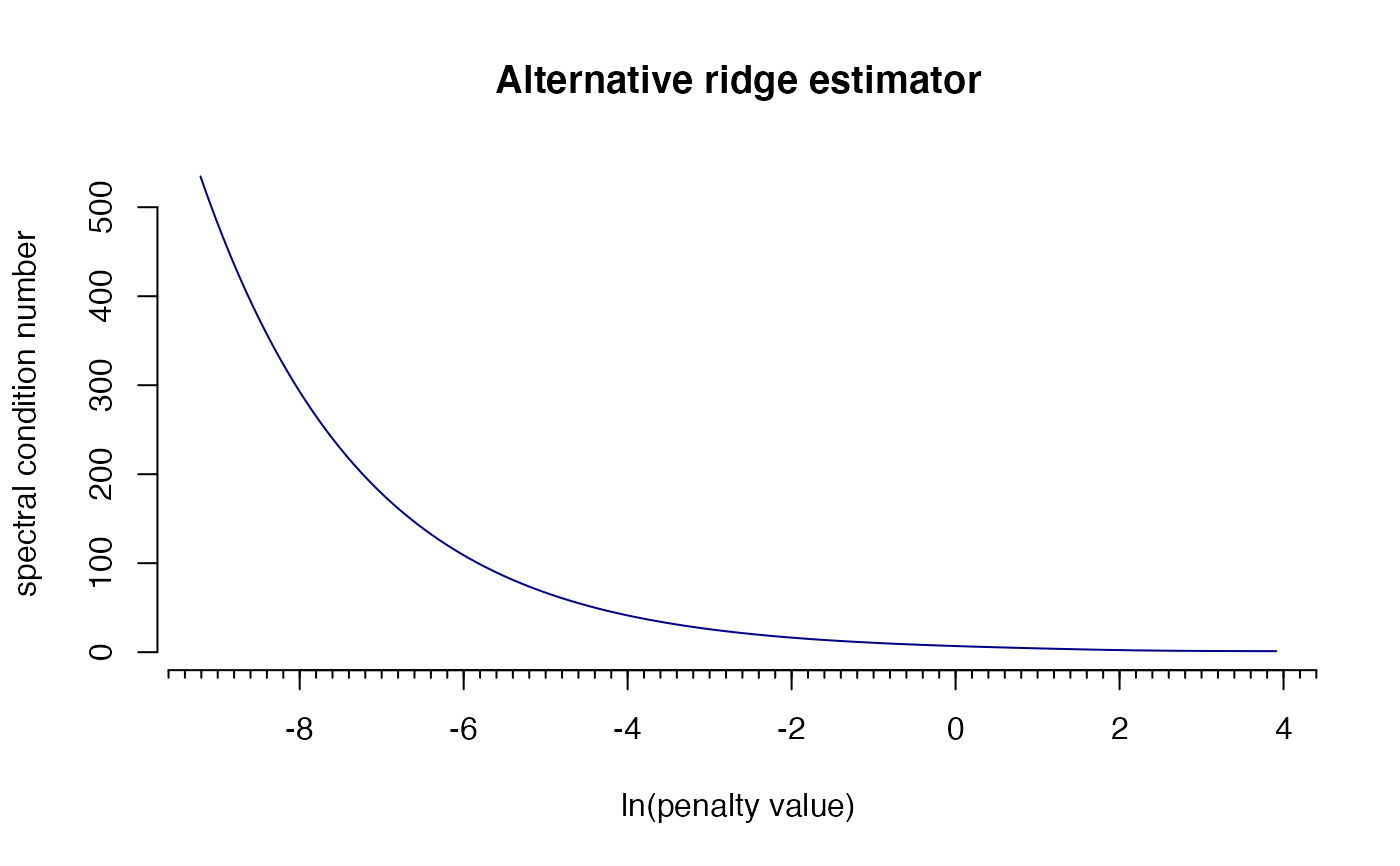
Visualize the spectral condition number against the regularization parameter
Source:R/rags2ridgesDepr.R
conditionNumberPlot.RdThis function is now deprecated. Please use CNplot instead.
conditionNumberPlot(
  S,
  lambdaMin,
  lambdaMax,
  step,
  type = "Alt",
  target = default.target(S),
  norm = "2",
  digitLoss = FALSE,
  rlDist = FALSE,
  vertical = FALSE,
  value,
  main = TRUE,
  nOutput = FALSE,
  verbose = TRUE
)
Arguments
- S
Sample covariance
matrix.- lambdaMin
A
numericgiving the minimum value for the penalty parameter.- lambdaMax
A
numericgiving the maximum value for the penalty parameter.- step
An
integerdetermining the number of steps in moving through the grid [lambdaMin,lambdaMax].- type
A
characterindicating the type of ridge estimator to be used. Must be one of: "Alt", "ArchI", "ArchII".- target
A target
matrix(in precision terms) for Type I ridge estimators.- norm
A
characterindicating the norm under which the condition number is to be calculated/estimated. Must be one of: "1", "2".- digitLoss
A
logicalindicating if the approximate loss in digits of accuracy should also be visualized in the output graph.- rlDist
A
logicalindicating if the relative distance to the set of singular matrices should also be visualized in the output graph.- vertical
A
logicalindicating if output graph should come with a vertical line at a pre-specified value for the penalty parameter.- value
A
numericindicating a pre-specified value for the penalty parameter.- main
A
logicalindicating if output graph should contain type of estimator as main title.- nOutput
A
logicalindicating if numeric output should be returned.- verbose
A
logicalindicating if information on progress should be printed on screen.
Value
The function returns a graph. If nOutput = TRUE the function
also returns an object of class list:
- lambdas
A
numericvector representing all values of the penalty parameter for which the condition number was calculated.- conditionNumbers
A
numericvector containing the condition number for each value of the penalty parameter given inlambdas.
Details
See CNplot.
See also
Examples
## Obtain some (high-dimensional) data
p = 25
n = 10
set.seed(333)
X = matrix(rnorm(n*p), nrow = n, ncol = p)
colnames(X)[1:25] = letters[1:25]
Cx <- covML(X)

## Assess spectral condition number across grid of penalty parameter
conditionNumberPlot(Cx, lambdaMin = .0001, lambdaMax = 50, step = 1000)
#> Perform input checks...
#> Calculating spectral condition numbers...
#> Plotting...