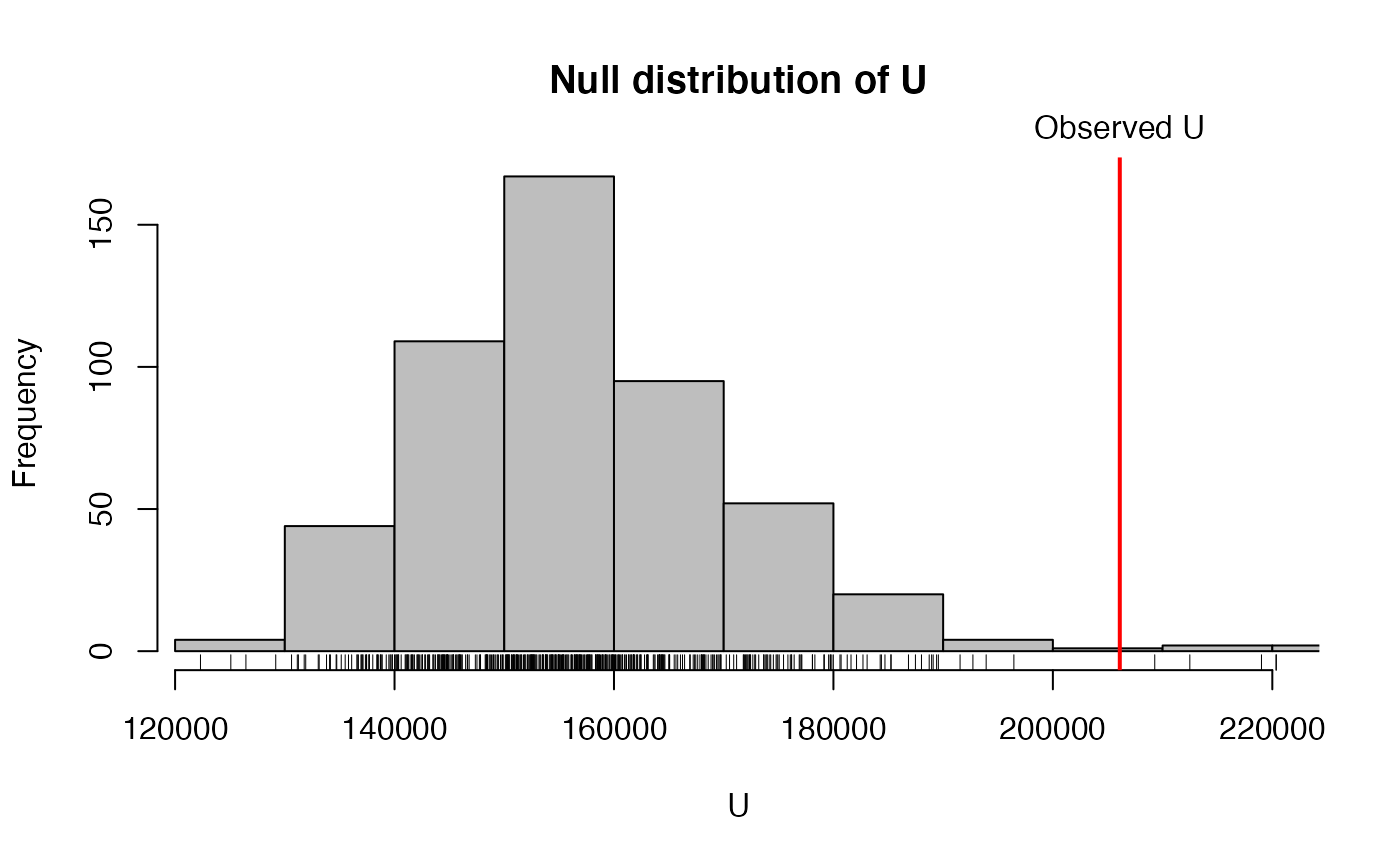
Plot a histogram of the null distribution and the observed test statistic in a permutation type "fusion test".
Arguments
- x
A
ptestobject (a list). Usually the output offused.test.- add.extra
A logical. Add extra information to the plot.
- ...
Arguments passed to
plot.
Value
Invisibly returns x with extra additions.
Details
plot.ptest is simply a wrapper for hist.ptest.
References
Bilgrau, A.E., Peeters, C.F.W., Eriksen, P.S., Boegsted, M., and van Wieringen, W.N. (2020). Targeted Fused Ridge Estimation of Inverse Covariance Matrices from Multiple High-Dimensional Data Classes. Journal of Machine Learning Research, 21(26): 1-52.
See also
Examples
ns <- c(10, 5, 23)
Ylist <- createS(ns, p = 15, topology = "banded", dataset = TRUE)

# Use the identity target matrix for each class
Tlist <- replicate(length(ns), diag(15), simplify = FALSE)

# Do the test
lam <- matrix(10, 3, 3)
diag(lam) <- 1
ft <- fused.test(Ylist, Tlist, lambda = lam, n.permutations = 500)

# The returned object can alo be plotted via
hist(ft)

# or via the alias
plot(ft)
# or via the alias
plot(ft)