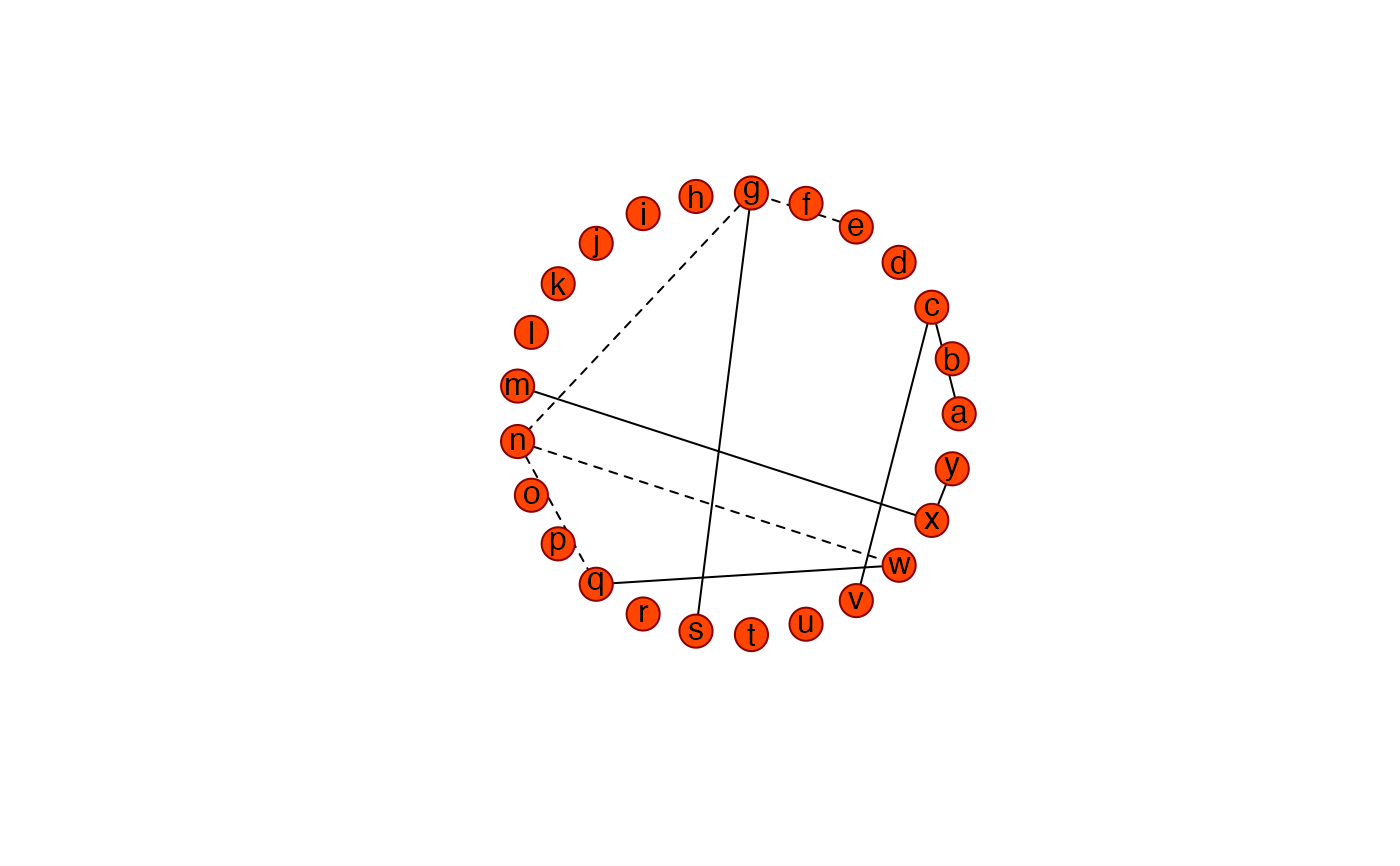
Function that calculates various network statistics from a sparse precision matrix. The sparse precision matrix is taken to represent the conditional indepence graph of a Gaussian graphical model.
GGMnetworkStats(sparseP, as.table = FALSE)Arguments
Value
An object of class list when as.table = FALSE:
- degree
A
numericvector with the node degree for each node.- betweenness
A
numericvector representing the betweenness centrality for each node.- closeness
A
numericvector representing the closeness centrality for each node.- eigenCentrality
A
numericvector representing the eigenvalue centrality for each node.- nNeg
An
integervector representing the number of negative edges for each node.- nPos
An
integervector representing the number of positive edges for each node.- chordal
A
logicalindicating if the implied graph is chordal.- mutualInfo
A
numericvector with the mutual information (with all other nodes) for each node.- variance
A
numericvector representing the variance of each node.- partialVariance
A
numericvector representing the partial variance of each node.
When
as.table = TRUE the list items above (with the exception of
chordal) are represented in tabular form as an object of class
matrix.
Details
The function calculates various network statistics from a sparse matrix. The
input matrix P is assumed to be a sparse precision or partial
correlation matrix. The sparse matrix is taken to represent a conditional
independence graph. In the Gaussian setting, conditional independence
corresponds to zero entries in the (standardized) precision matrix. Each
node in the graph represents a Gaussian variable, and each undirected edge
represents conditional dependence in the sense of a nonzero corresponding
precision entry.
The function calculates various measures of centrality: node degree, betweenness centrality, closeness centrality, and eigenvalue centrality. It also calculates the number of positive and the number of negative edges for each node. In addition, for each variate the mutual information (with all other variates), the variance, and the partial variance is represented. It is also indicated if the graph is chordal (i.e., triangulated). For more information on network measures, consult, e.g., Newman (2010).
References
Newman, M.E.J. (2010). "Networks: an introduction", Oxford University Press.
Examples
## Obtain some (high-dimensional) data
p = 25
n = 10
set.seed(333)
X = matrix(rnorm(n*p), nrow = n, ncol = p)
colnames(X)[1:25] = letters[1:25]
Cx <- covML(X)

## Obtain sparsified partial correlation matrix
Pridge   <- ridgeP(Cx, 10, type = "Alt")
PCsparse <- sparsify(Pridge , threshold = "top")$sparseParCor
#> - Retained elements:  10
#> - Corresponding to 3.33 % of possible edges
#>

## Represent the graph and calculate GGM network statistics
Ugraph(PCsparse, "fancy")
#> Warning: 'as.is' should be specified by the caller; using TRUE
#> Warning: 'as.is' should be specified by the caller; using TRUE

#>              [,1]       [,2]
#>  [1,]  1.00000000  0.0000000
#>  [2,]  0.96858316  0.2486899
#>  [3,]  0.87630668  0.4817537
#>  [4,]  0.72896863  0.6845471
#>  [5,]  0.53582679  0.8443279
#>  [6,]  0.30901699  0.9510565
#>  [7,]  0.06279052  0.9980267
#>  [8,] -0.18738131  0.9822873
#>  [9,] -0.42577929  0.9048271
#> [10,] -0.63742399  0.7705132
#> [11,] -0.80901699  0.5877853
#> [12,] -0.92977649  0.3681246
#> [13,] -0.99211470  0.1253332
#> [14,] -0.99211470 -0.1253332
#> [15,] -0.92977649 -0.3681246
#> [16,] -0.80901699 -0.5877853
#> [17,] -0.63742399 -0.7705132
#> [18,] -0.42577929 -0.9048271
#> [19,] -0.18738131 -0.9822873
#> [20,]  0.06279052 -0.9980267
#> [21,]  0.30901699 -0.9510565
#> [22,]  0.53582679 -0.8443279
#> [23,]  0.72896863 -0.6845471
#> [24,]  0.87630668 -0.4817537
#> [25,]  0.96858316 -0.2486899
if (FALSE) GGMnetworkStats(PCsparse) # \dontrun{}